For IT teams and MSPs

Monitor to identify issues before they escalate

Monitor device health properties to identify and alert issues in real-time, reduce downtime, and keep performance on point.

No credit card required · 14-day free trial

Network monitoring is the continuous observation of devices, traffic, and services across a network to detect outages and performance issues before users do. Domotz delivers real-time SNMP monitoring, custom dashboards, and instant alerts across 40K+ networks in 190 countries at $1.50 per managed device per month.

The Domotz difference

  • Real-time alerting on any performance or SNMP metrics.

  • Highlight configuration misalignments for easier triage.

  • Custom scripting allows for unlimited monitoring.

When users report the issue before you see it, you’re already behind.

Domotz allows you to monitor health attributes so you can act fast and resolve issues before they escalate.

Understand device health with SNMP monitoring

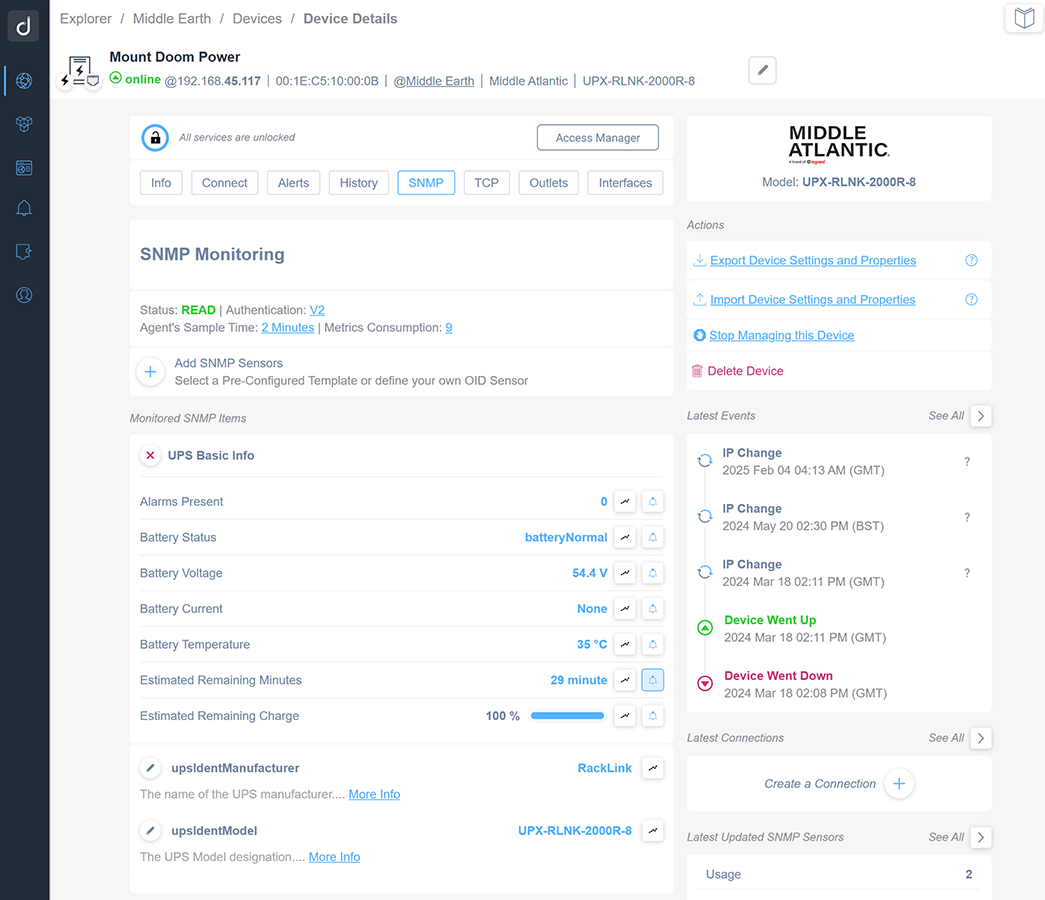
Understand device health with SNMP monitoring.

When SNMP metrics aren’t monitored, issues often go undetected until it’s too late which results in reactive firefighting, prolonged downtime, and frustrated stakeholders. Easily monitor SNMP-enabled devices and key metrics with Domotz to understand their health and performance:

  • Monitor SNMP-enabled devices with ease.
  • Track performance metrics such as CPU load, temperature, fan speed, memory, battery health, and more.
  • Use the built-in MIB Browser to explore device data and find OID values for custom templates.
Receive real-time alerts to catch issues sooner

Receive real-time alerts to catch issues sooner.

Relying on others to report issues slows down response times, adds unnecessary back-and-forth, and makes it harder for IT to stay in command.

Get real-time alerts from Domotz to catch and resolve network issues before they turn into support tickets.

  • Get notified when devices go offline, IP addresses change, SNMP thresholds are triggered, or configurations drift.
  • Receive alerts via email, mobile push, or directly into your ticketing system.
Visualize performance with custom Monitoring Dashboards

Visualize performance with custom Monitoring Dashboards.

Manually managing lists of devices across multiple sites can be tedious and prone to error, making it harder to spot performance trends or pinpoint issues quickly.

Build custom dashboards with Domotz to see exactly what matters most, anytime:

  • Display device status, SNMP values, and network performance across selected sites.
  • Choose the metrics and devices you want to track, and matching devices are added automatically.
Identify configuration misalignment to maintain network stability 1
Identify configuration misalignment to maintain network stability 2

Identify configuration misalignment to maintain network stability.

Keeping device configurations aligned across sites is tough without the right tools, increasing the risk of downtime and security gaps.

Prevent configuration drift before it leads to bigger issues with automated configuration monitoring.

  • Instantly see when a device setup changes by comparing it to the last known backup.
  • View exactly what changed so you can quickly identify and correct misalignments.

Typically, we wouldn’t know about an issue until the customer called us saying, ‘Hey, my internet’s down’ or ‘The wireless has stopped working.’ Now, we’re able to call the customer first or have a ticket started and be investigating things before they even notice.

Kevin White, CEO, TRINUS Tech Kevin White CEO, TRINUS Tech

Built to help you see and know more about your networks to solve problems faster.

FAQ

Frequently asked questions

What IT teams and MSPs ask about monitoring networks with Domotz.

  • What is network monitoring?
    Network monitoring is the continuous observation of devices, traffic, and services across a network to detect outages and performance issues before users do. Domotz monitors device health properties — SNMP metrics, uptime, connectivity, and configuration state — across every site in a single view, with real-time alerts when anything drifts.
  • Does Domotz support SNMP monitoring?
    Yes. Domotz monitors any SNMP-enabled device and tracks performance metrics such as CPU load, temperature, fan speed, memory, and battery health. A built-in MIB Browser lets you explore device data and find OID values for custom templates. See SNMP Monitoring for details.
  • How does Domotz alert on network issues?
    Domotz sends real-time alerts when devices go offline, IP addresses change, SNMP thresholds are triggered, or configurations drift. Alerts can be delivered via email, mobile push, or directly into your ticketing system through Shared Alerts.
  • Can Domotz detect configuration drift?
    Yes. Domotz automatically backs up device configurations and compares each new configuration to the last known backup, so you can instantly see when a device setup changes and what changed. See Network Configuration Management.
  • How much does Domotz network monitoring cost?
    Domotz is a flat $1.50 per managed device per month. Device discovery is free — you see every device on a network at no cost and only pay for the devices you choose to actively monitor.