Virtual machines & containers monitoring
Monitor and secure Virtual Machines (VMs) and Container environments with Domotz.
Rely on advanced monitoring features to gain real-time visibility into the health and performance of the VMs and containers you monitor.
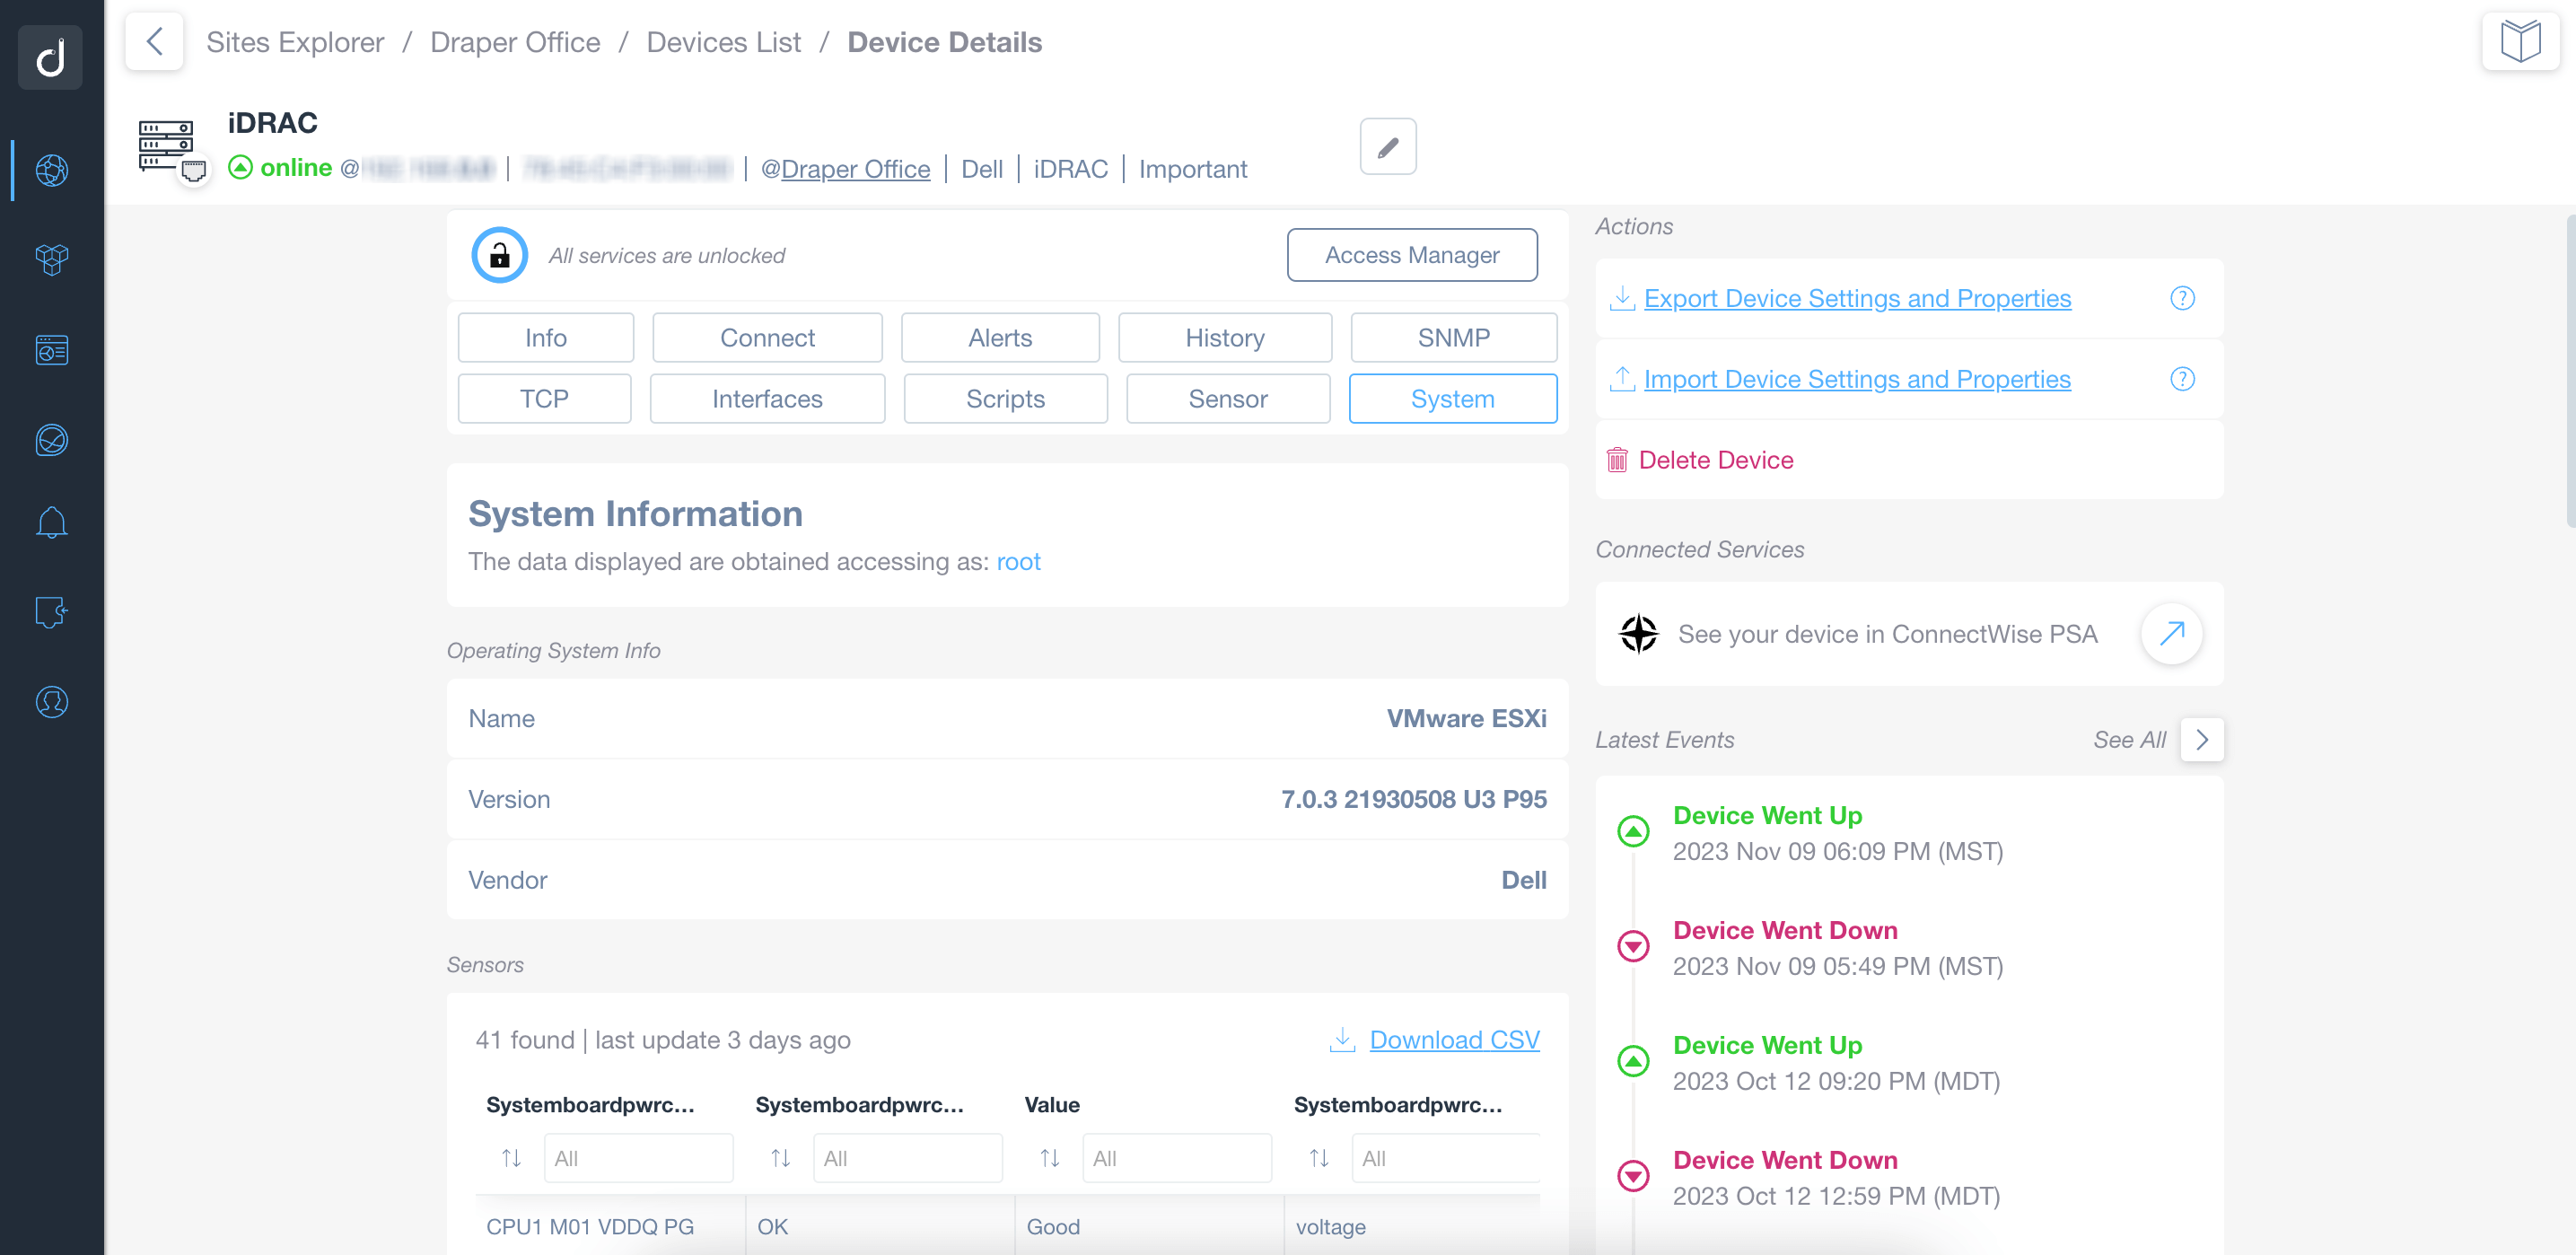
Use Domotz to extract crucial information such as OS/VM name/version, vendor, architecture, memory size, power status, and more using our dedicated features:
Streamline your VM monitoring, ensuring reliability and performance in virtualized environments.

Monitoring Virtual Machines

Domotz offers Virtual Machine monitoring to retrieve more information from your VM device.
Use our intuitive dashboard to get real-time insights into your VM health. We leverage various metrics to monitor VMs, such as CPU usage, memory consumption, disk activity, and network traffic.
There are two ways you can retrieve additional information about your VMs:
- OS monitoring feature will help you get access to the OS name, OS version, vendor, architecture, serial number, and more. For example, you can check our dedicated page about VMware ESXi Monitoring
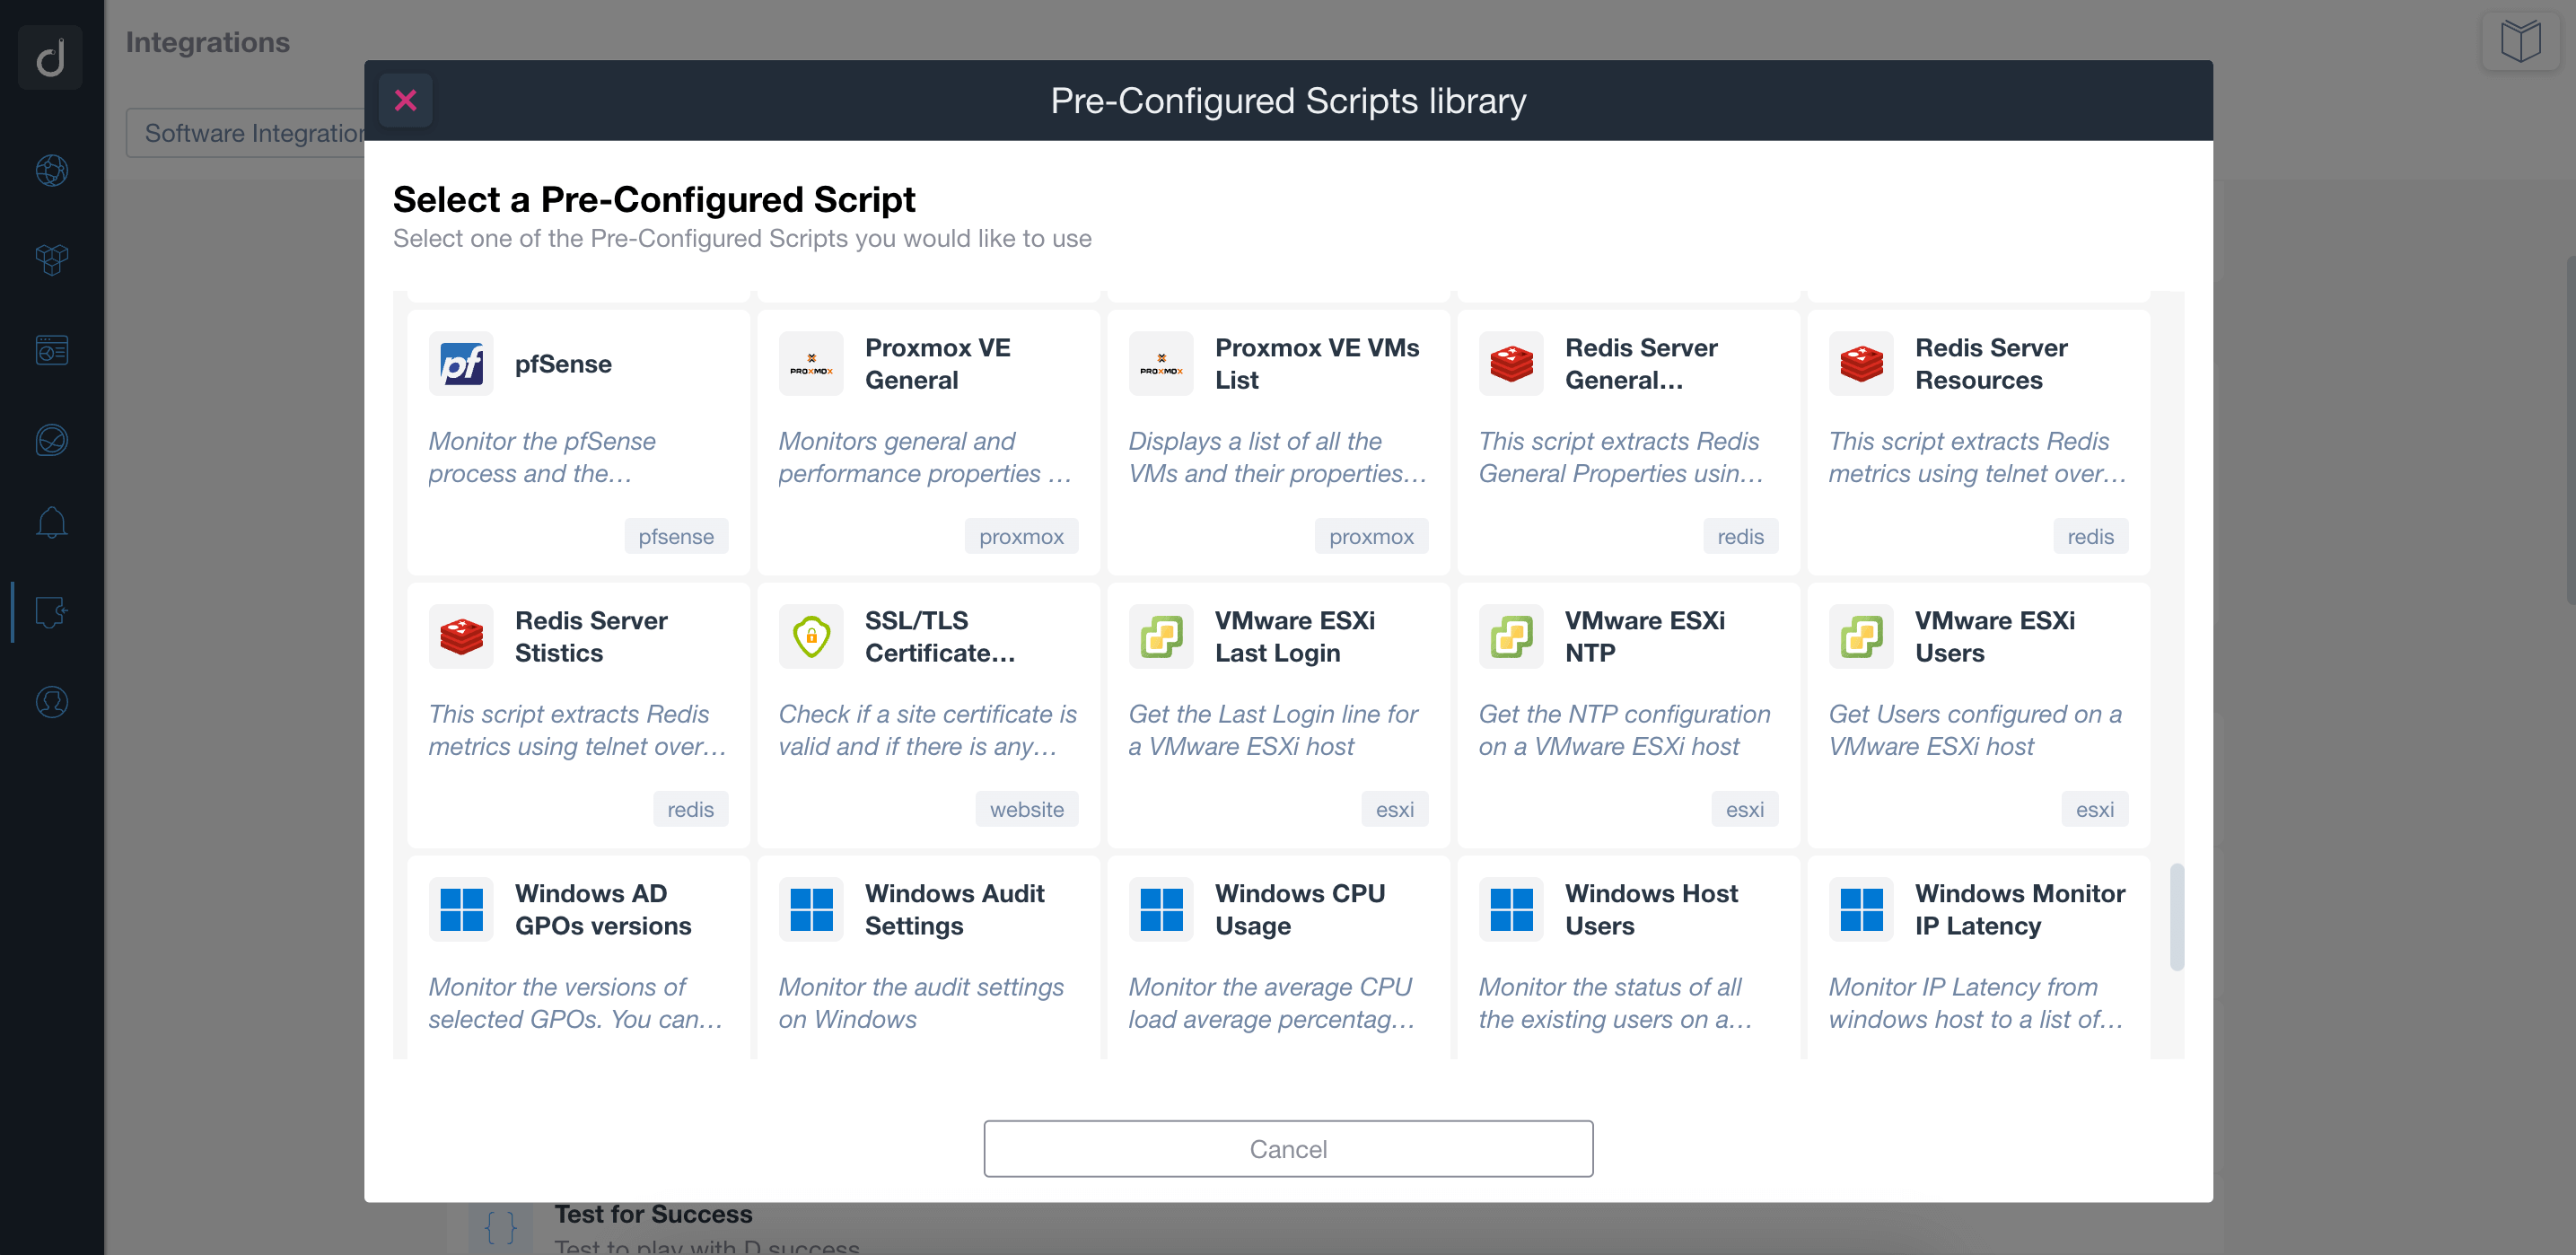
- Automation & Scripts feature will provide ready-to-use scripts that you can use directly from our library or customize to fit your needs. You can rely on the custom scripts to automatically create a table with the information about your VMs. For example, you can check out our custom scripts about Proxmox
In addition, you can set customizable alerts, facilitating rapid response to potential problems. Domotz will also track VM resource allocation, helping you to optimize performance and resource utilization.
Monitoring Containers

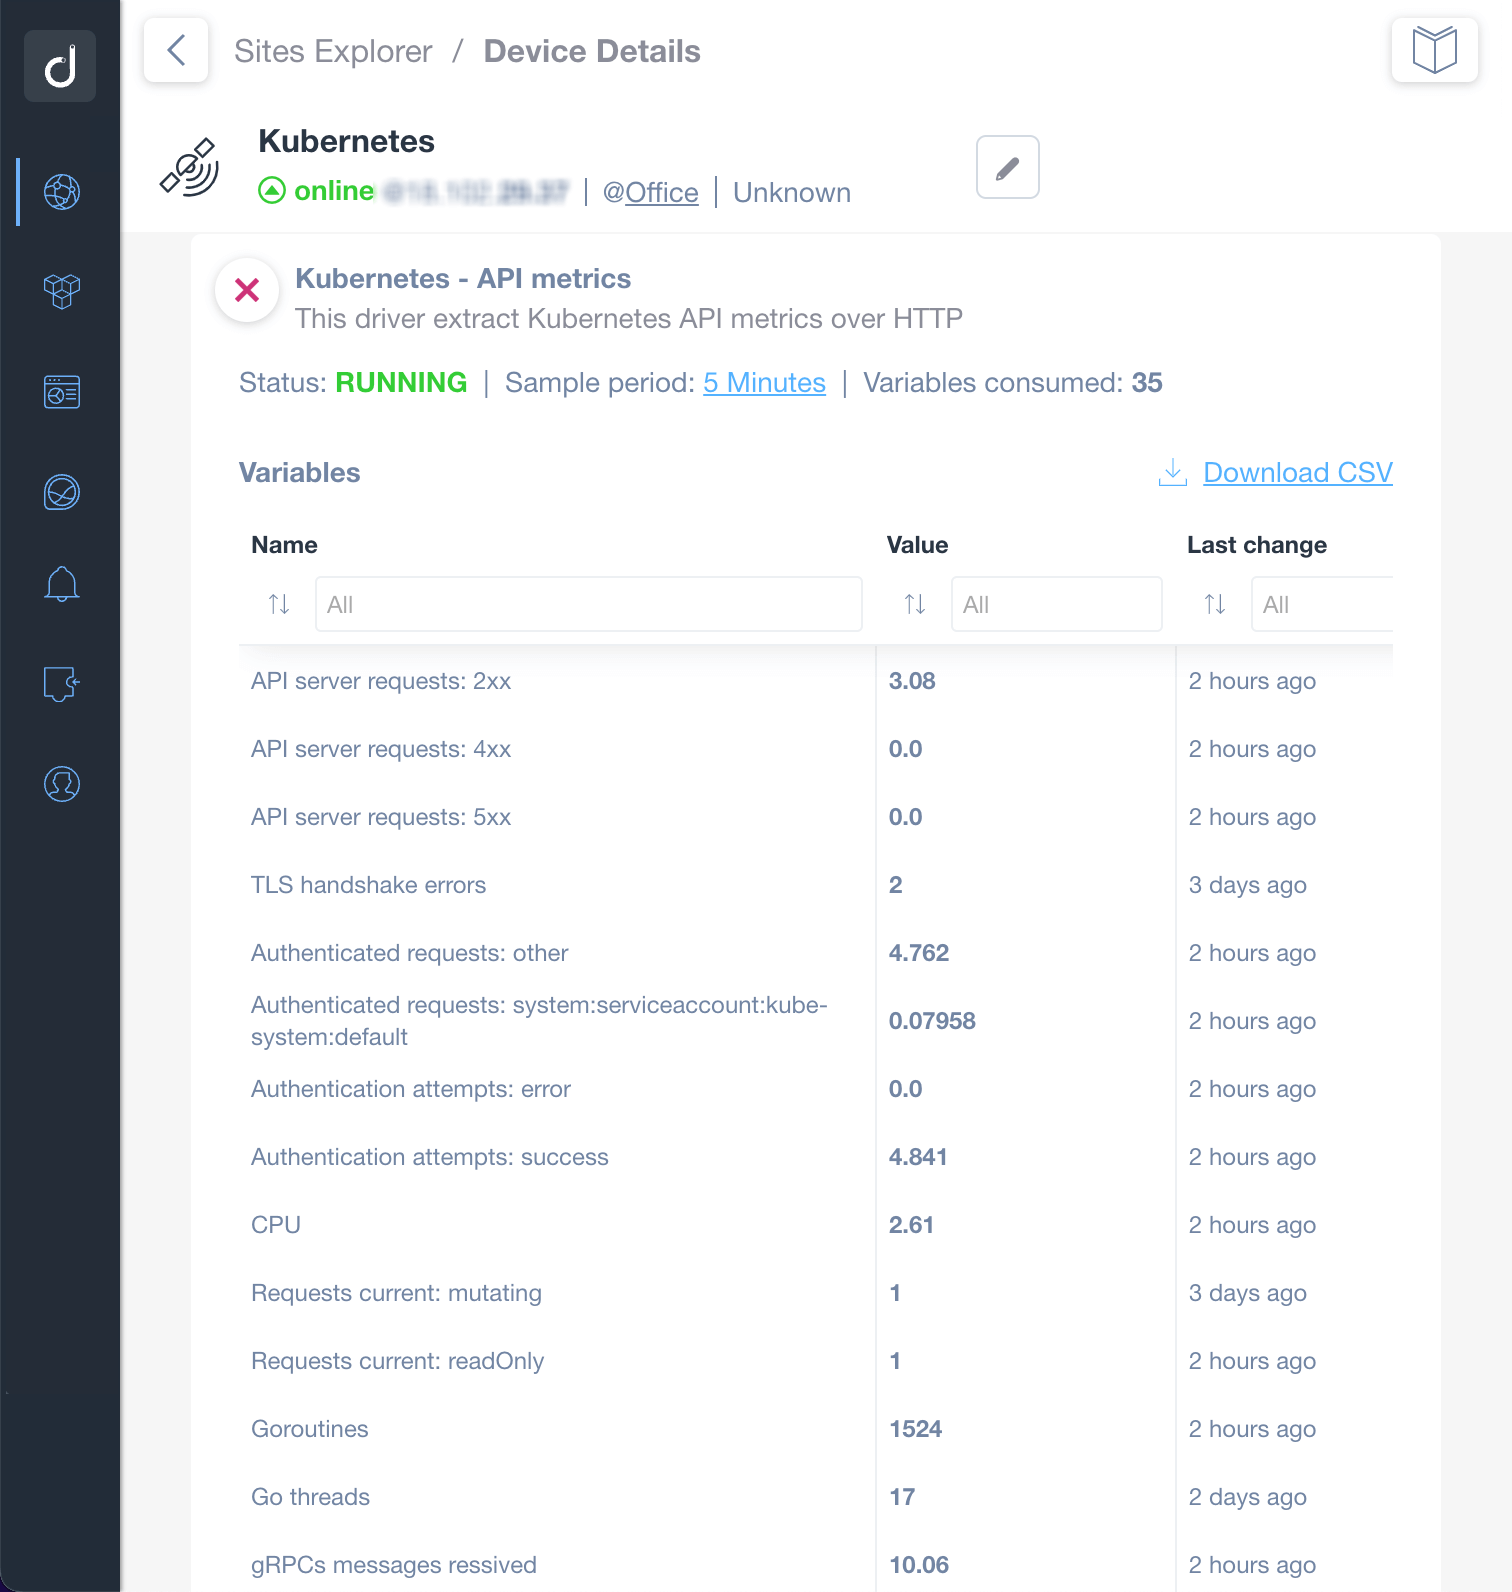
Keep a watchful eye on your Container infrastructure. Use the Domotz Automation & Scripts feature to access important information about your containers.
This feature will help you create a table with the following metrics:
- CPU Consumption
- CPU and Memory Location
- API Server Requests
- Clusters Information
- Nodes/Pods
- Routines
- And more
You can find the ready-to-use custom script in our library.
Find more information about using the custom scripts in our Kubernetes Monitoring.
Ready to Get Started?
- Uncover Network Blind Spots
- Resolve Issues Faster and Easier
- Exceed Service Delivery Expectations